Ros Grafana 展示数据
配置ROS
添加一个用户,以便MKTXP访问API
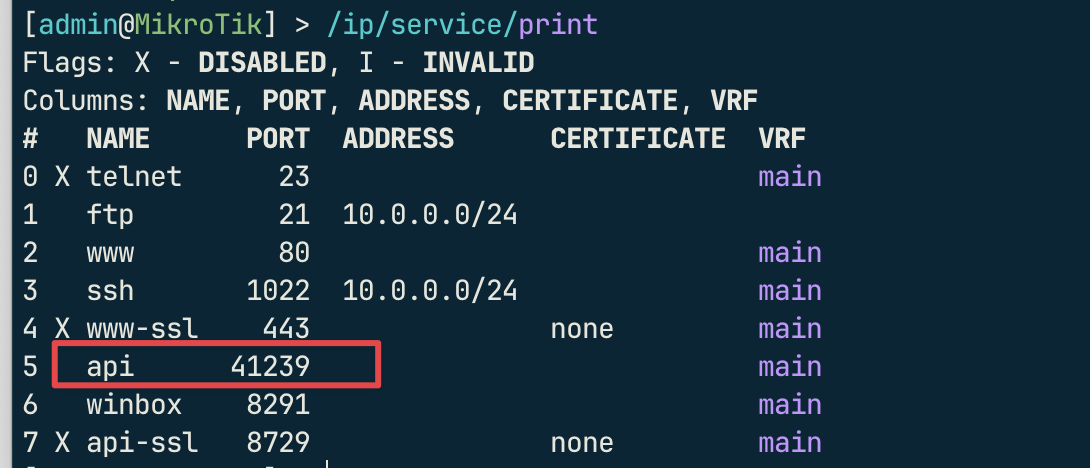
/user group add name=mktxp_group policy=api,read/user add name=mktxp1 group=mktxp_group password=wozhendebuai确保API开启,并记录API端口
/ip/service/print我这里是41239

安装MKTXP
创建配置文件
mkdir mktxp
vim mktxp/mktxp.conf
⚠️记得修改hostname、username、password
[RB5009]
enabled = True # turns metrics collection for this RouterOS device on / off
hostname = 10.0.0.1 # RouterOS IP address
port = 41239        # RouterOS API / API-SSL service port
username = mktxp1   # RouterOS user, needs to have 'read' and 'api' permissions
password = wozhendebuai

use_ssl = False                # enables connection via API-SSL servis
no_ssl_certificate = True     # enables API_SSL connect without router SSL certificate
ssl_certificate_verify = False # turns SSL certificate verification on / off

installed_packages = True # Installed packages
dhcp = True               # DHCP general metrics
dhcp_lease = True         # DHCP lease metrics

connections = True      # IP connections metrics
connection_stats = True # Open IP connections metrics

pool = True      # Pool metrics
interface = True # Interfaces traffic metrics

firewall = True       # IPv4 Firewall rules traffic metrics
ipv6_firewall = True # IPv6 Firewall rules traffic metrics
ipv6_neighbor = False # Reachable IPv6 Neighbors

poe = False              # POE metrics
monitor = True           # Interface monitor metrics
netwatch = True          # Netwatch metrics
public_ip = True         # Public IP metrics
route = True             # Routes metrics
wireless = False         # WLAN general metrics
wireless_clients = False # WLAN clients metrics
capsman = False          # CAPsMAN general metrics
capsman_clients = False  # CAPsMAN clients metrics

kid_control_devices = False # Kid Control metrics

user = True  # Active Users metrics
queue = True # Queues metrics

remote_dhcp_entry = None # An MKTXP entry for remote DHCP info resolution (capsman/wireless)

use_comments_over_names = True # when available, forces using comments over the interfaces names

check_for_updates = False # check for available ROS updates
vim mktxp/_mktxp.conf## Copyright (c) 2020 Arseniy Kuznetsov
##
## This program is free software; you can redistribute it and/or
## modify it under the terms of the GNU General Public License
## as published by the Free Software Foundation; either version 2
## of the License, or (at your option) any later version.
##
## This program is distributed in the hope that it will be useful,
## but WITHOUT ANY WARRANTY; without even the implied warranty of
## MERCHANTABILITY or FITNESS FOR A PARTICULAR PURPOSE. See the
## GNU General Public License for more details.
[MKTXP]
port = 49090
socket_timeout = 2
initial_delay_on_failure = 120
max_delay_on_failure = 900
delay_inc_div = 5
bandwidth = False # Turns metrics bandwidth metrics collection on / off
bandwidth_test_interval = 600 # Interval for colllecting bandwidth metrics
minimal_collect_interval = 5 # Minimal metric collection interval
verbose_mode = True # Set it on for troubleshooting
fetch_routers_in_parallel = False # Set to True if you want to fetch multiple routers parallel
max_worker_threads = 5 # Max number of worker threads that can fetch routers (parallel fetch only)
max_scrape_duration = 10 # Max duration of individual routers' metrics collection (parallel fetch only)
total_max_scrape_duration = 30 # Max overall duration of all metrics collection (parallel fetch only) docker run -d --name=mktxp -v "$(pwd)/mktxp/:/home/mktxp/mktxp/" -p 49090:49090 ghcr.io/akpw/mktxp:latest安装Prometheus
mkdir prometheus
vim prometheus/prometheus.yml
⚠️记得修改下方10.0.0.188为你自己的ip
global:
  scrape_interval: 15s # Set the scrape interval to every 15 seconds. Default is every 1 minute.
  evaluation_interval: 15s # Evaluate rules every 15 seconds. The default is every 1 minute.
  # scrape_timeout is set to the global default (10s).

scrape_configs:
  - job_name: 'mktxp'
    static_configs:
      - targets: ['10.0.0.188:49090']
docker run -d \
-p 9090:9090 \
-v "$(pwd)/prometheus/prometheus.yml:/etc/prometheus/prometheus.yml" \
prom/prometheus 安装Grafana
docker run -d -p 3000:3000 --name=grafana grafana/grafana-oss默认账户密码都是admin
配置Prometheus data source:http://10.0.0.188:9090
save&test
点击加号,import dashboard,模板id:13679,数据源选刚刚创建的
本文由 不爱折腾 创作,采用 知识共享署名4.0 国际许可协议进行许可。
本站文章除注明转载/出处外,均为本站原创或翻译,转载前请务必署名。